Boost engagement and pipeline with standout events.
BROWSE EVENTS PRODUCTS
Live
Virtual
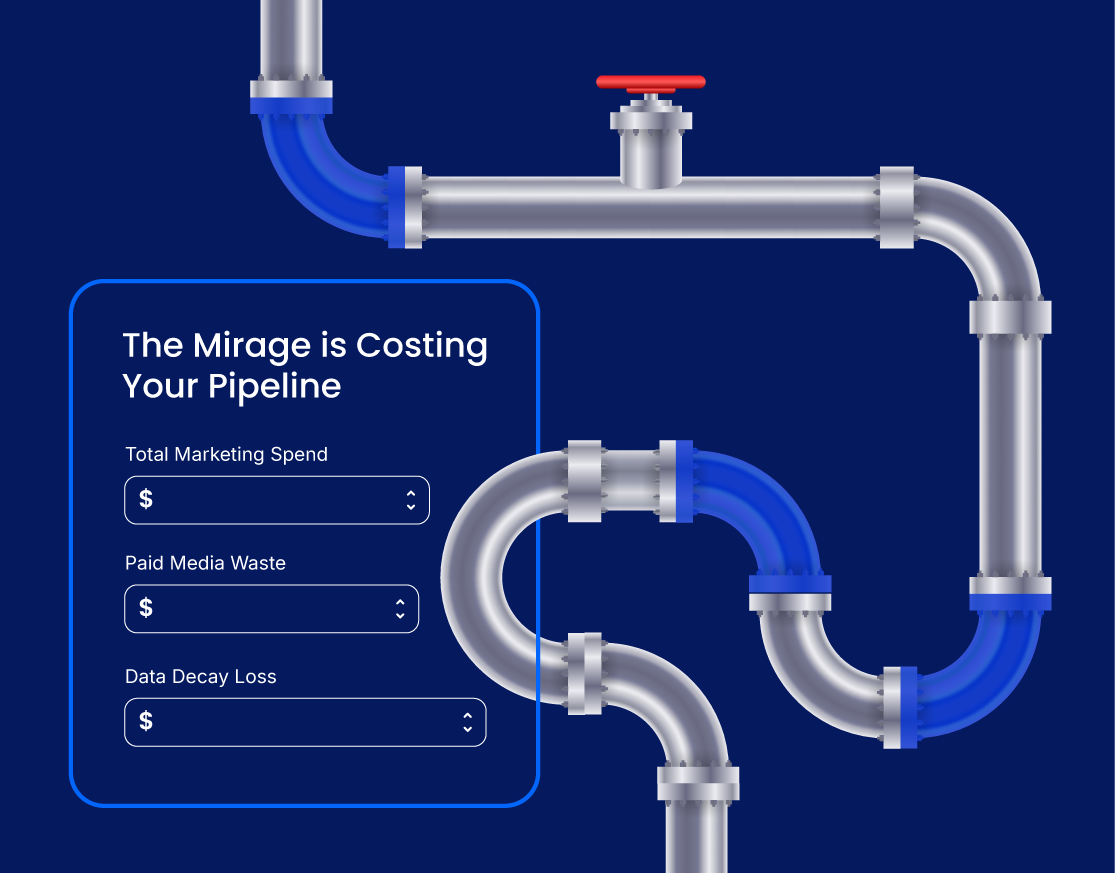
Data Mirage Calculator
See the True Cost of Bad Data
Unverified signals and disconnected tools can make your dashboards look good while draining your budget. Find out how much of your spend is lost to the Mirage
Marketers invest millions across media, content, tools, and campaigns. But much of that spend never reaches real
buyers.
The Data Mirage creates the illusion of precision – while bad signals, disconnected tools, content that doesn’t
convert,
and fragmented execution drain your budget.
This calculator reveals how much of your marketing spend is lost to the Mirage.
Don’t worry if you don’t know exact numbers — we’ll use industry benchmarks to give you a fast, accurate estimate.
What’s the Data Mirage?
The Marketing Data Mirage is the illusion that your data and campaigns are working, when in fact much of your
spend
is wasted on fraud, false signals, siloed tools, fragmented execution, and content that doesn’t connect with
buyers.
Your Total Program Spend
Enter your annual program spend, which represents the non-personnel, discretionary portion of your marketing budget. This includes categories like paid media, content, website/SEO/AI optimization, martech, events, and other program investments. Please exclude salaries and internal team budgets such as PR, AR, and Corporate/Brand Marketing, as these are not part of program spend for this assessment.
⬇️ Scroll down to complete all 6 budget breakdown fields
Budget Breakdown
Fill in all budget fields…
How Efficient Is Your Paid Media?
Media spend is hit hard by fraud, unsuitable placements, and inflated CPMs.
25%
Industry average: 20–30% of paid media traffic is fraudulent or bot-generated.
Adjust based on your fraud detection data.
50%
Typical inefficiency from poor targeting, wrong placements, or ads shown outside your ICP. Most B2B programs
waste 40–60% of media spend on unsuitable audiences.
How Much of Your Data Stays Fresh?
Even the best data goes stale. Every year, up to 25% of contacts and buying signals become outdated as people change jobs, titles, or companies. This erosion silently reduces the effectiveness of campaigns that depend on accurate data.
25%
B2B contact data decays at ~25–30%
per year (job changes,
outdated emails, wrong titles). Adjust based on your database age and maintenance practices.
50%
What % of your marketing depends on contact data accuracy (email, ABM, content
syndication, etc.). Adjust based on your channel mix.
Your Mirage Cost
Total Marketing Spend
$0
Total Waste
$0
0%
Net Effective Spend
$0
Waste Breakdown
Paid Media Waste$0
Data Decay Loss$0
This is your wasted spend. To see the business impact (lost pipeline and revenue), continue.
Your Information
Please hold on, we’re calculating your results.
Unlock Your Pipeline & Revenue Impact
Enter your details and confirm your performance ratios. We’ll calculate the pipeline and revenue you may be missing due to wasted marketing spend.
Please hold on, we’re calculating your results.
Your Performance Ratios
5×
Pipeline value created per $1 of marketing spend. Typical target range: 3–6×; best-in-class 8×+.
1.5×
Total revenue generated per $1 of marketing spend. Typical range: 3–5× for SaaS (multi-year value) or 1–2×
for first-year only.
You’ve seen the waste. Now see what it’s really costing you.
See How the Mirage Impacts Your Pipeline and Revenue
Now that you’ve uncovered your total marketing waste, see what that means in real business terms. This screen quantifies how lost efficiency translates into missed pipeline and revenue opportunities and lets you experiment with the numbers to see potential upside from improvement.
Total Waste
$0
0%
Lost Pipeline
$0
5× pipeline-to-spend multiple
Lost Revenue
$0
1.5× revenue-to-spend multiple
Adjust these assumptions to see how each factor drives total waste, pipeline, and revenue.
Media Efficiency
25%
Industry average: 20–30% of paid media traffic is fraudulent or bot-generated.
Adjust based on your fraud detection data.
50%
Typical inefficiency from poor targeting, wrong placements, or ads shown outside your ICP. Most B2B programs
waste 40–60% of media spend on unsuitable audiences.
Data Quality
25%
B2B contact data decays at ~25–30%
per year (job changes,
outdated emails, wrong titles). Adjust based on your database age and maintenance practices.
50%
What % of your marketing depends on contact data accuracy (email, ABM, content
syndication, etc.). Adjust based on your channel mix.
Business Multipliers
5×
Most B2B programs generate 4–6× pipeline per $1 spent; best-in-class can reach 8×.
1.5×
Typical first-year revenue multiples are 1–2× per $1
spent; SaaS companies counting multi-year contracts often reach 3–5×.
💡 Insight
Every % of efficiency you recover drives measurable growth. Reducing your Data Mirage waste by just 10% could restore millions in pipeline and revenue.
Please hold on, we’re processing your request.
Ready to Eliminate the Mirage?
You’ve seen how much the Mirage is costing you. Now see which buyers are real. Get your free Buyer Insight Report from DemandScience.
See What’s Behind Your Results
You’ve seen your numbers, now dig deeper into where those costs come from and how to end the Mirage for good.
The True Cost of the Marketing Data Mirage
Get the numbers behind the illusion. See where budgets really leak, and how verified precision helps marketers recover lost ROI.
See how Ionic connects verified intent, engagement, and activation data across every channel, so you can finally trust your performance metrics and growth forecast.